Europe‘s Waste Management Quantitative: Eurostat and EU Commission Delivered Key Figures
In November 2013, European Parliament and Council launched an Environment Action Programme themed “Living well, within the limits of our planet“. It focused on improving waste prevention and management in the Union to make better use of resources, open up new markets, create new jobs and reduce dependence on imports of raw materials. Currently, Eurostat has released “Key figures on Europe 2016“ whereas the EU Commission published an “Environmental Implementation Review“. Both papers offer a first quantitative assessment to the implementation of the program.
At the time of the Action Programme, the European Union produced 2.7 billion tons of waste each year, of which 98 million tons (4 percent) were hazardous. In 2011, per capita municipal waste generation averaged 503 kg throughout the Union, but ranged from 298 to 718 kg across individual Member States. On average, only 40 percent of solid waste was prepared for re-use or recycled whereas some Member States achieved a rate of 70 percent. At the same time, many Member States landfilled over 75 percent of their municipal waste.
Mineral waste accounts for two thirds
According to newer figures from 2014, the total waste generated in the EU-28 by all economic activities and households amounted to 2,598 million tons – with considerable variations across EU-28 Member States. The average amount of waste generated across the EU-28 reached 5,118 kg – equivalent to more than five tons per inhabitant. Construction waste contributed to 33.5 percent of the total with 871 million tons and was followed by mining and quarrying with 29.8 percent respectively 774 million tons, manufacturing with 256 million tons or 9.8 percent, households with 209 million tons or 8.1 percent and energy with 95 million tons or 3.7 percent; the remaining 15 percent were generated from other economic activities, mainly including waste and water services by 8.8 percent and services by 3.8 percent. Almost two thirds respectively 65 percent of the total waste generated in 2014 was mineral waste. Some 95.6 million tons or 3.7 percent of the total were classified as hazardous waste.
43 percent still disposed
In 2014, some 2,145 million tons of waste including waste imported were treated in the EU-28. 43.6 percent – more than two fifths – of the waste treated was subject to disposal operations other than waste incineration. A further 39.0 percent was sent to recovery operations other than energy recovery and backfilling. Over one tenth (10.8 percent) of the waste treated was backfilled for the purpose of slope reclamation or safety or for engineering purposes in landscaping. The remaining 6.5 percent of the waste treated in the EU-28 was sent for incineration, either with energy recovery or without.
Landfilling down, recovery up
Significant differences could be observed among the EU Member States concerning the use they made of the various treatment methods. The quantity of waste landfilled in 2014 was 16 percent lower than it had been in 2004. The quantity of waste recovered – recycled or backfilled – grew from 890 million tons in 2004 to 1,069 million tons between 2004 and 2014, i.e.: by 20.1 percent. As a result, the share of such recovery in total waste treatment rose from 42.1 percent to 49.9 percent at the same time. Simultaneously waste incineration including energy recovery saw an overall increase of 29.6 percent and its share of the total rose from 5.1 percent to 6.5 percent.
In total, 75.6 million tons of hazardous waste were treated in the European Union in 2014. Nearly half of this total (49.1 percent) was deposited into or onto land or through land treatment and release into water bodies. Some 6.0 percent of all hazardous waste was incinerated without energy recovery and a further 7.4 percent with energy recovery. 37.5 percent of hazardous waste in 2014 in the EU-28 was recovered by recycling or backfilling.
A plus of 34 percent full-time jobs
The risen resource productivity should not be forgotten – the relation between economic activity and the consumption of natural resources: Between 2000 and 2015, it increased from from 1.48 Euro/kg to 2.00 Euro/kg, even if not steadily. In particular, the financial and economic crisis marked a change in 2008. Until 2008 resource productivity reported a steady but modest annual increase of 8.2 percent. From 2014, the index surged from 1.60 Euro/kg to 2.00 Euro/kg.
Eurostat balances that the environmental economy in Europe has developed primarily through the renewable energy sector by adding of more than a million full-time equivalents respectively an increase of 187 percent. But the second most important contribution to employment growth in the environmental economy came from the domain of waste management, with employment rising from 828,000 to 1.1 million full-time equivalents in 2013 – an overall increase of 34 percent since 2000.
Waste prevention remains a challenge
It needs more than pure numbers to describe the status of the European waste management. This is proven by the “Environmental Implementation Review“, lately presented by the EU Commission. Its authors come to the conclusion, that waste prevention remains an important challenge in all Member States, including those with high recycling rates. Nine countries need to step up their efforts significantly to reach their target by 2020. Six Member States have not managed to limit the landfilling of biodegradable municipal waste to 50 percent. Five Member States miss at least some regional plans, while one state does not even have a national plan on waste management in place. In another five Member States, lack of coordination between the different administrative levels and fragmented governance of environmental issues have been identified. Around half of the Member States have to increase the effectiveness of separate waste collection. And several pricings of residual waste treatment are inappropriate and do not provide sufficient incentives to push waste towards the higher levels of the waste hierarchy.
Concerning all States: Instruments and amendments
To eliminate these weak points by and by, the Commission compiled a catalogue of specifications, including a limited number of actions that need to be given priority in each Member State:
■ Introduce policies, including economic instruments (Extended Producer Responsibility, Pay As You Throw schemes), to implement further the waste hierarchy, i.e. promote prevention, and make reuse and recycling more economically attractive. Eliminate free-riding and ensure financial viability of waste management companies.
■ Shift reusable and recyclable waste away from incineration by gradually phasing out subsidies to incineration or by introducing an incineration tax.
■ Introduce and/or gradually increase landfill taxes to phase-out landfilling of recyclable and recoverable waste. Harmonize regional landfill taxes. Pursue the review of the level of landfill gate fees. Use the revenues from the economic instruments to support the separate collection and alternative infrastructure.
■ Focus on implementation of the separate collection obligation to increase recycling rates and prioritize the separate collection of bio-waste in order to increase composting rates. Establish sites for collection of specific waste in each municipality.
■ Complete and update the Waste Management Plan(s) and/or Waste Prevention Program(s) in order to cover the whole territory.
■ Finalize the work on the irregular landfills as a matter of high priority.
■ Avoid building excessive infrastructure for the treatment of residual waste.
■ Ensure waste statistics are compatible with Eurostat Guidelines. Improve consistency of data on waste management from various sources (also as to the large gap between waste generated and treated).
■ Intensify cooperation between the regions to use waste treatment capacity more efficiently and to achieve the national recycling targets.
■ Strengthen and empower enforcement capability.
The EU Commission comes to the conclusion: “All Member States have started work in this field but several are frontrunners and have adopted national or regional circular economy plans (e.g. the Netherlands, Belgium) or integrated them in other policies (e.g. Germany, France). Around 20 Member States have adopted schemes to make the goods and services they purchase (through public procurement) more sustainable. Such measures are key to truly ‘close the loop‘, going beyond waste management to cover the whole life-cycle of a product.“
However, these and other figures do not deliver advice whether “living well“ is drawn near or if “the limits of our planet“ have been maintained.
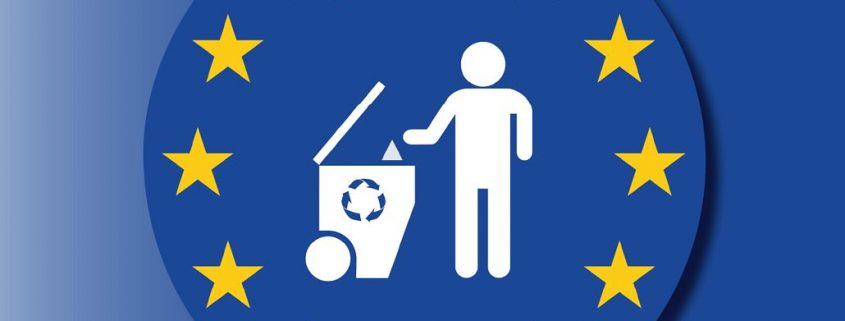
Photo: Atlantis / fotolia.com
GR12017-S
